26
Level 2
Board Level
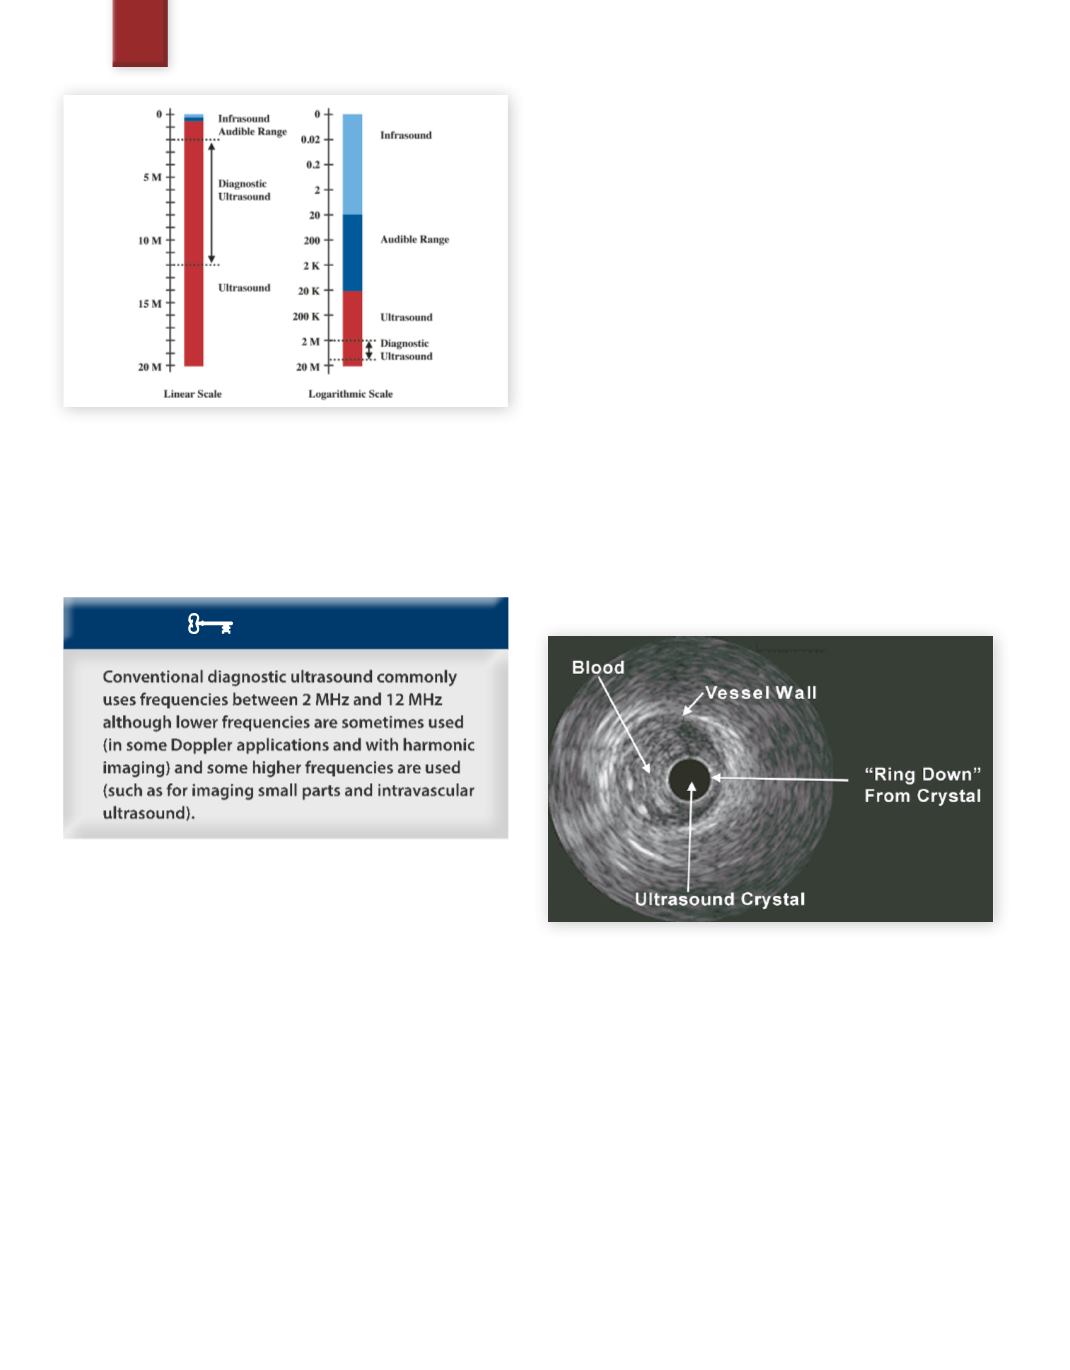
Fig. 31
Classification of sound (linear and logarithmic graphs)
Note: The two scales in Figure 31 give the exact same information.
Recall that logarithmic graphs are good for dealing with a large dy-
namic range. Because of the large dynamic range of this data, notice
how the logarithmic scale presentation is much easier to decipher than
the linear scale presentation.
KEY CONCEPT
Why 2 MHz to 12 MHz?
In general, conventional diagnostic ultrasound does not commonly
use frequencies much below 2 MHz because of poor detail resolu-
tion. From the wavelength equation,we know that a lower frequency
results in a longer wavelength. We will learn in later chapters that
longer wavelengths result in a diminishing ability to resolve struc-
tures close together and to discern fine detail. At some point, the
resolution is considered so poor that there is little reason to acquire
data. The frequency of 2 MHz, is generally the limit of acceptable
resolution. However, there are exceptions. Some newer harmonic
techniques will transmit at frequencies lower than 2 MHz and
receive at frequencies near or above 2 MHz. Also, there are some
applications of Doppler which do not require high resolution, but
do require extraordinary sensitivity,and therefore utilize frequencies
slightly below 2 MHz. (generally around 1.6 or 1.8 MHz)
The upper limit of 10 MHz or 12 MHz is dictated by the inability
of higher frequency sound to penetrate deep into the patient. In
Chapter 3, the concept of attenuation will be fully discussed. For
now, you should realize that the diagnostic frequency range really
demonstrates one of the classic trade-offs on diagnostic ultrasound:
resolution versus penetration.
Just as there are exceptions to using frequencies below 2MHz, there
are obvious exceptions to using frequencies above 12MHz. For small
parts imaging, if the imaging is very superficial, it is now common
to exceed the 10 or 12 MHz range.
Intravascular Ultrasound (Frequencies Above the
Typical Diagnostic Range)
Another example of when higher frequencies are used for diagnostic
ultrasound is intravascular ultrasound. Intravascular ultrasound
(IVUS) began in the late 1980’s and, depending on the application,
uses frequencies as high as 30 to 40 MHz. The primary goal of in-
travascular ultrasound is to assess vessel walls and help characterize
plaquemorphology. The transducer is either a single rotated element
or a very small phased array. The transducer, contained within a
sheath, is attached to the end of a catheter usually less than 1 mm
in diameter. The high frequencies are desirable for maximal resolu-
tion. Since the imaging depths are so shallow, and since there is no
air interface,these high frequencies are tenable. The following image
of
Figure 32
, demonstrates an IVUS image from a coronary artery.
Fig. 32
Intravascular Ultrasound (IVUS) image of a
coronary artery
Therapeutic Ultrasound (Physiotherapy and HIFU)
Therapeutic ultrasound (physiotherapy) has been in use for many
years, and has been increasing in efficacy. Therapeutic ultrasound
is used to increase blood flow and manage several soft tissue condi-
tions such as muscle spasm, tendonitis, and bursitis. Additionally,
therapeutic ultrasound is used to reduce joint contractures, scar
tissue, and pain as well as to promote wound healing. The typical
frequency range for therapeutic ultrasound is between 0.5MHz and
3.0 MHz, and most commonly, a frequency close to 1 MHz is used.
Beam intensities range from about 0.25W/cm
2
to as high as 2.5W/
cm
2
resulting in tissue temperature rises as high as 4 degrees Celsius
up to depths of about 5 cm.
SAMPLE PAGE


