Chapter 10: Contrast and Harmonics
337
10
Fig. 26
The following frames of
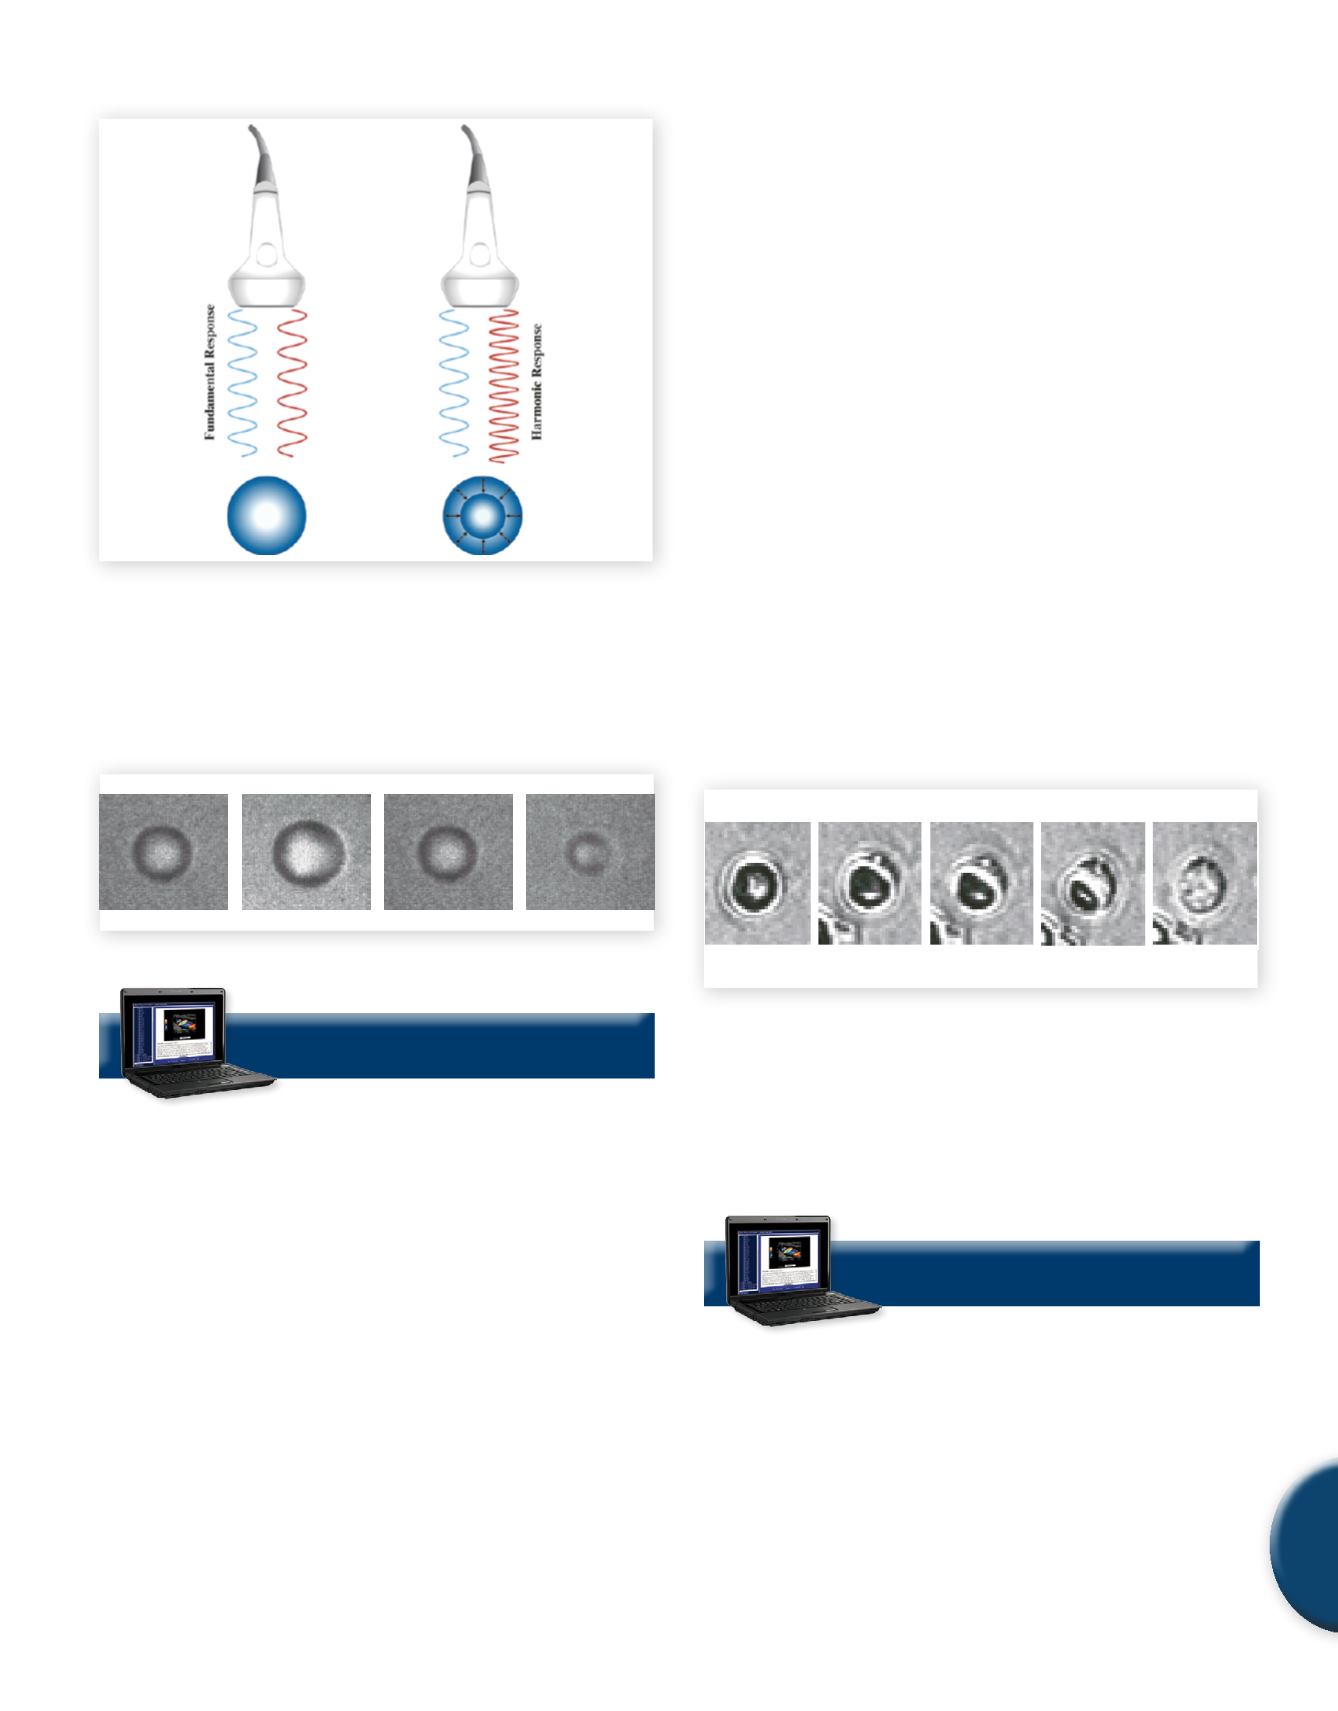
Figure 27
were captured from stable non-
linear oscillations of a lipidmicrobubble using a high speed camera.
A video is included in the online image library so that time variance
can be appreciated.
Fig. 27
Non-linear bubble oscillation
VIEW ONLINE ANIMATION AND IMAGE LIBRARY
10.4 Bubble Disruption
Even at these low MIs, where bubbles can exhibit stable non-linear
behavior, some microbubbles begin to be disrupted or “destroyed.”
Since a given contrast agent is comprised of a wide range of mi-
crobubbles with varying sizes and shell thicknesses, the disruption
occurs over a continuum of MIs rather than at a certain threshold.
A typical range where this may occur would be between anMI of 0.1
and 0.4. However, if the MI is kept below 0.2, most contrast agents
will “survive” and continue to work effectively.
The composition of the shell of a particular contrast agent can lead
to differences in the mechanism for disruption. Lipid encapsulated
microbubbles tend to be more pliable than albumin-shelled micro-
bubbles and thus tend to be more acoustically responsive at lower
MIs. At these low MIs, microbubble disruption can be caused by
the forced outward diffusion of gas, often referred to as acoustically
driven diffusion. The oscillation of the microbubble will cause
some gas to be “squeezed” out with each transmit pulse. This effect
has been seen more in lipid-encapsulated microbubbles than in
albumin-shelled microbubbles. It has been proposed that this is
due to the increased flexibility of the lipid shell coupled with the
high concentration gradient of the gas. Larger excursions about the
resting radius cause a larger pressure gradient to be created during
maximal compression which leads to an increase in outward dif-
fusion. At low MIs even small changes in resting microbubble size
can have a significant effect in terms of the acoustic response. For
bubbles close to resonance size, there will be a significant decrease
in response before the microbubble has completely dissolved.
With stiffer-shelled microbubbles, such as those that are albumin
based, there is often the creation of a shell defect caused by the
ultrasound pulse. This is followed by subsequent diffusion through
the “crack” and dissolution of the free gas into the surrounding
blood. This dissolution can occur quickly if the gas is nitrogen
based (e.g., 10 ms) or much slower if it contains a higher density,
less diffusible gas such as a perfluorocarbon. The signal from a free
perfluorocarbon bubble can last for hundreds of milliseconds before
it dissolves. As in the forced-diffusion case, there will be significant
decrease in received signal intensity even before the microbubble
is completely dissolved.
t
0
t
40 ms
t
80 ms
t
160 ms
t
240 ms
Fig. 28
Shell defect produced by ultrasound pulse
Figure 28
demonstrates diffusion of gas from the microbubble
followed by dissolution. The first frame labeled “t
o
” represents the
bubble prior to excitation. The subsequent frames indicate the time
transpired from excitation and make apparent the diffusion of gas
from a shell defect produced by the ultrasound pulse.
VIEW ONLINE ANIMATION AND IMAGE LIBRARY
As the MI continues to increase single pulse destruction can occur.
Under the appropriate conditions, large excursions in microbubble
radius can lead to fragmentation or can break up a single micro-
bubble into multiple microbubbles. In this case, one ultrasound
pulse can cause a microbubble to be “pinched off” or to be split
into multiple smaller microbubbles that then dissolve very quickly.
The decrease in intensity from the microbubble will happen almost
instantaneously,over microseconds. This effect can happen to either
nitrogen based bubbles or perfluorocarbon based bubbles. High-
SAMPLE PAGE


